The Broad View
Note: Prologis Research is pleased to introduce a new proprietary metric: Prologis True Months of Supply (TMSTM). TMS describes the precise interplay of supply and demand.
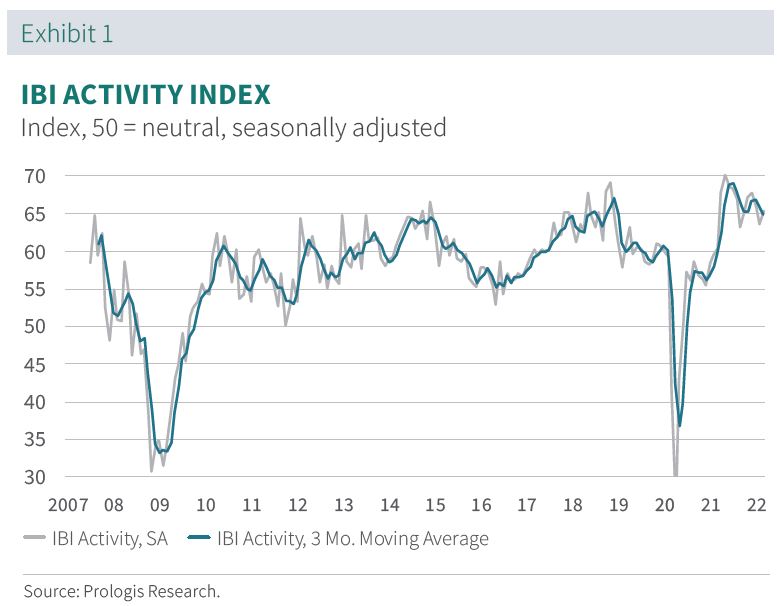
Prologis’ IBITM Activity Index was high across our 29 U.S. markets in Q1 2022, at 65 (> 50 indicates growth). This activity reflects a stronger flow of goods and the “catch-up” race by logistics users to secure limited space.
Select IBI takeaways:
1. Competition for space led to record Q1 rent growth. Rents increased by 8.5 percent quarter-over-quarter.1
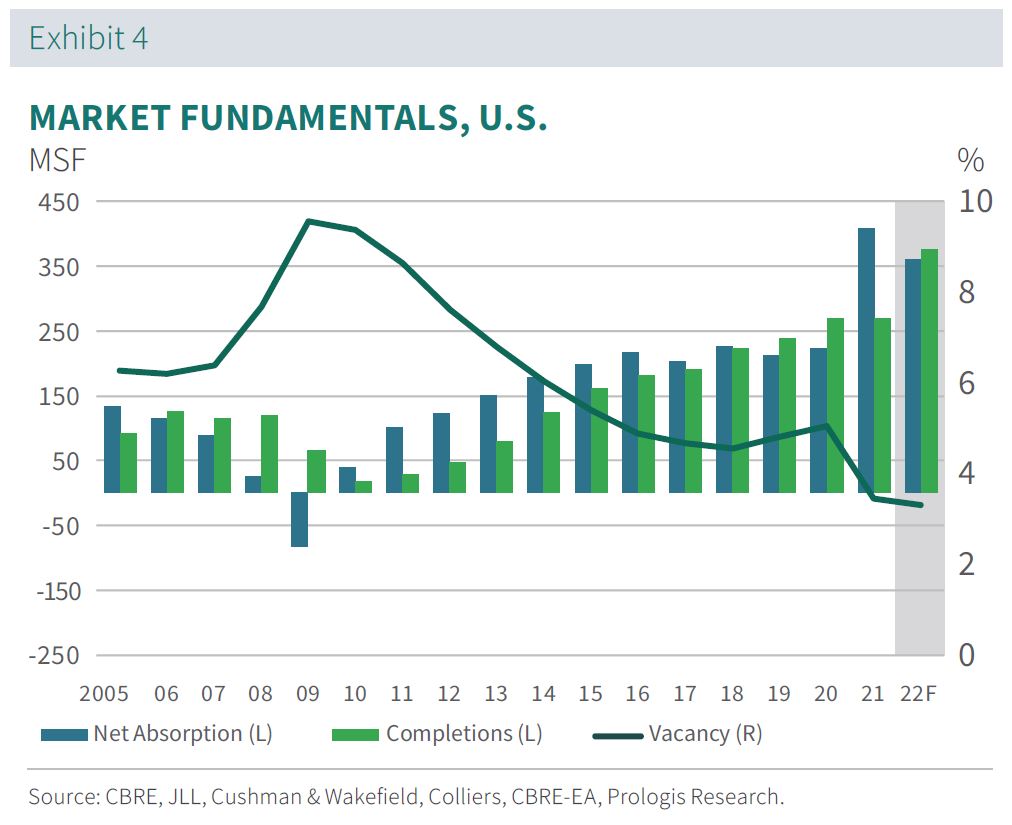
2. Healthy consumer spending and supply chain volatility boosted demand for logistics real estate, yet low supply reduced absorption. Logistics customers absorbed 88 million square feet (MSF) in Q1, down from about 120 MSF in the prior quarter.2, 3
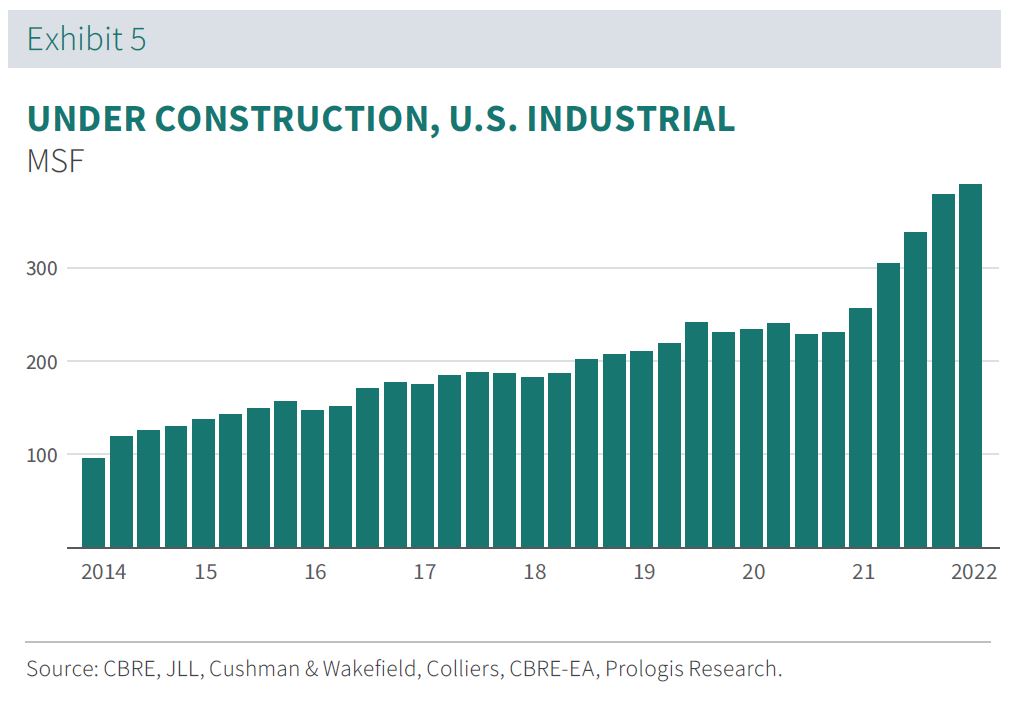
3. Materials shortages are fueling this scarcity. New supply in Q1 was lower than expected, at 68 MSF. The vacancy rate fell 20 basis points from the prior quarter to a record low of 3.2 percent
Q1 IBI Activity Index Deeper Dive:
-
Consumer spending and the rebuilding of inventories supported another quarter of solid demand for logistics real estate. The Q1 IBI reading of 65 is consistent with an annual demand run-rate of 320 MSF. Core retail sales were flat month-over-month and up 4 percent year-over-year as of March.4
-
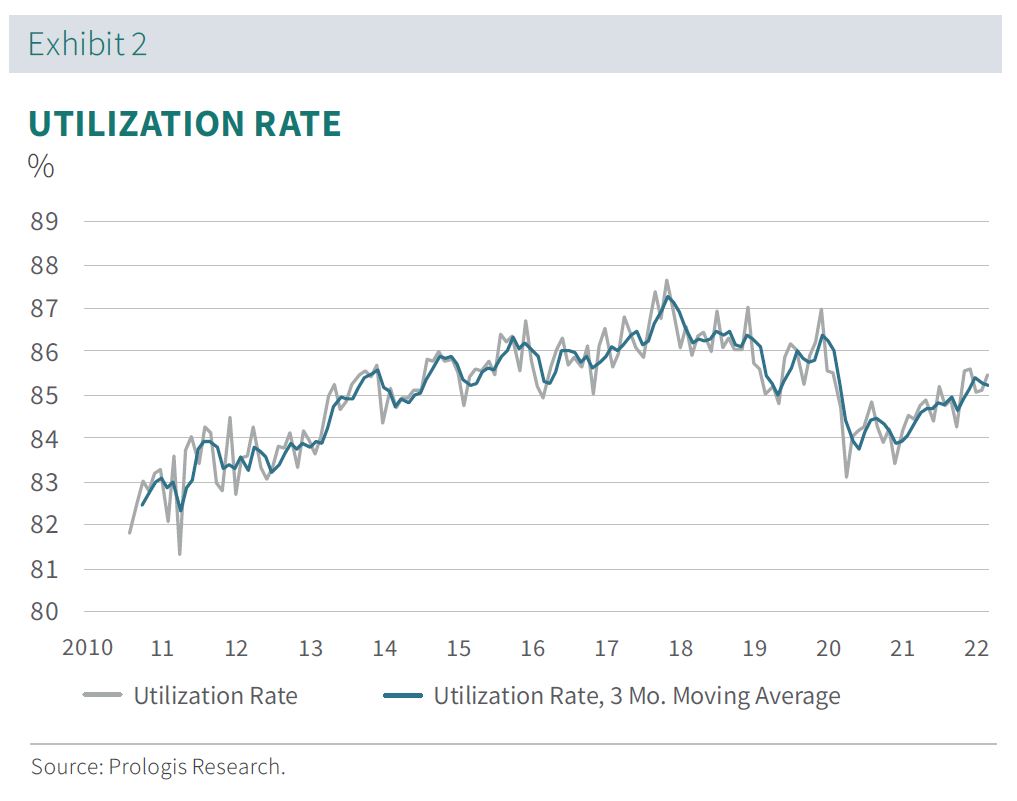
The flow of goods has opened as supply chain bottlenecks ease. The IBI utilization rate increased steadily to 85.5 percent in March from less than 85 percent in the previous quarter. However, retailers still do not have enough stock on hand: Inventory-to-sales ratios were 1.11 in February, nearly 10 percent below pre-pandemic levels.5 Prologis Research modeled a 5 percent decrease in the sales of goods and concluded that an incremental 800 MSF of logistics space would be needed to correct the current shortage and build inventory growth of 10 percent.

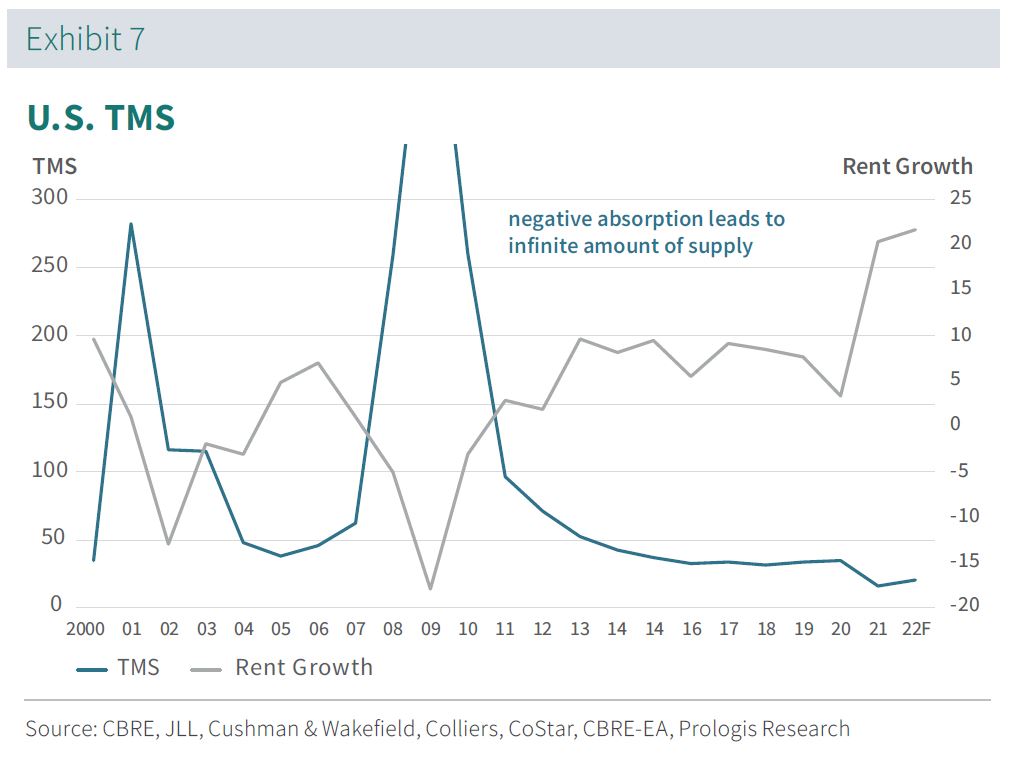
Prologis True Months of Supply (TMS) correlates to real estate leasing conditions. (see Exhibit 6) This proprietary measurement accurately captures supply/demand dynamics by comparing all vacant spaces (existing + unleased development pipeline) to trailing net absorption. Traditionally, months of supply for logistics real estate is calculated as the total development pipeline vs. net absorption. However, this can send inaccurate signals in markets with very low vacancy (and low trailing net absorption). TMS corrects for this disparity.

At the current rate, available logistics space in the U.S. would dry up in 16 months. (see Exhibit 7) The expansionary average is 36 months, and anything less than 50 months is consistent with positive real rent growth. Why so high? The U.S. is a mature logistics real estate market and tracked inventory contains more obsolete vacant space than less mature markets such as Europe, China and Latin America. U.S. TMS is at an all-time low, reflecting challenges for all customers who need to expand in a constrained market.
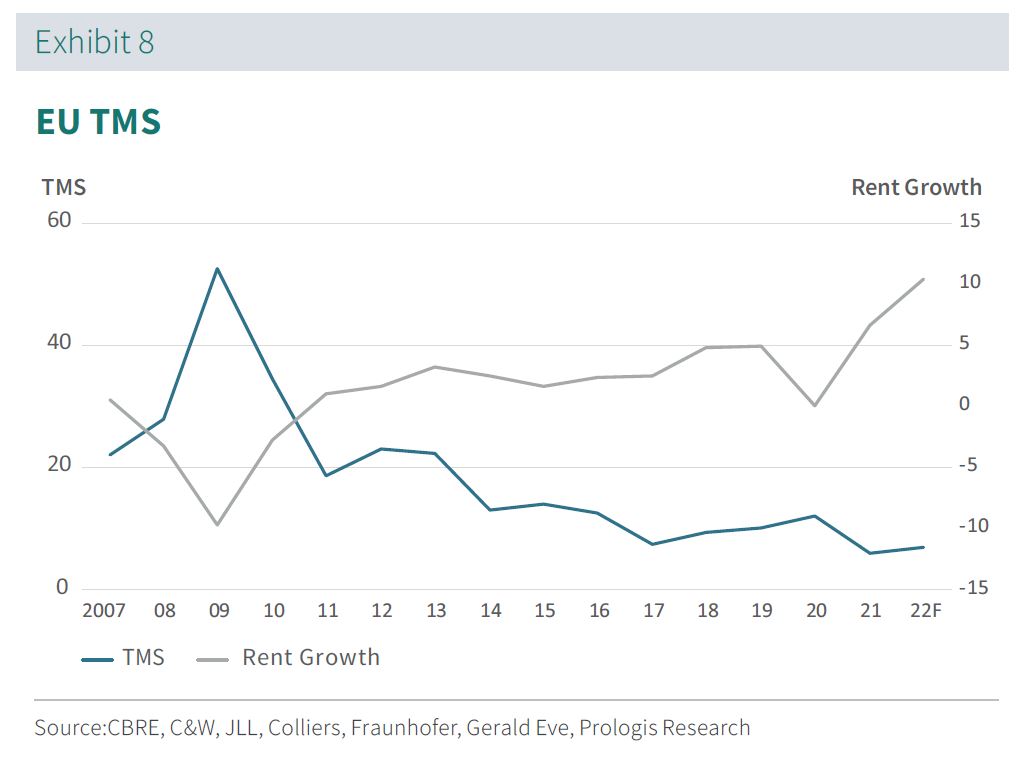
TMS in Europe is at a record low of six months. (see Exhibit 8) Europe tends to have a lower TMS than the U.S. due to a higher proportion of build-to-suit developments in the pipeline and newer logistics inventory with fewer obsolete vacancies. TMS has a high correlation (-0.9) with market rent growth since 2007

Endnotes
1. Prologis Research
2. CBRE, JLL, Cushman & Wakefield, Colliers, CoStar, CBRE-EA, Prologis Research.
3. Our historical and forecasted stock, net absorption, completions, under construction, and vacancy fundamentals now represent a narrowed 30 markets to reflect where Prologis has a presence.
4. U.S. Census Bureau; seasonally adjusted retail sales excluding food services, auto and gasoline.
5. U.S. Census Bureau; seasonally adjusted retail trade excluding motor vehicle and parts dealers.

