Introduction
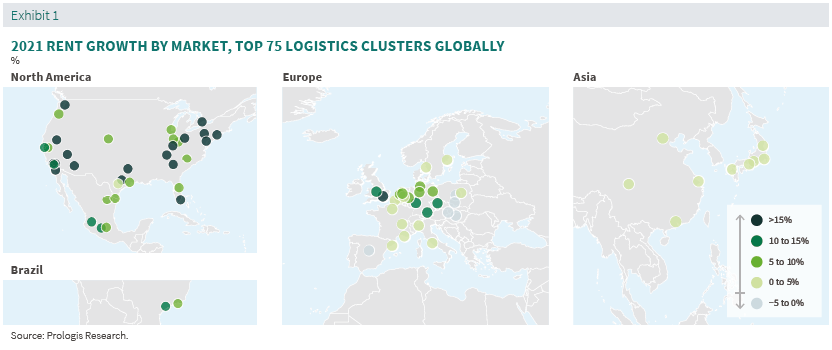
Introduced in 2015, the Prologis Logistics Rent Index examines trends in net eff ective market rental growth1 in key logistics real estate markets in North America, Europe, Asia and Latin America.2 Our proprietary methodology focuses on taking rents, net of concessions, for logistics facilities. To create the index, Prologis Research combines the company’s local insights on market pricing dynamics with data from our global portfolio. Rental rates at the regional and global levels are weighted averages based on estimates of market revenue.
Takeaways
• Bidding wars are increasing as available logistics space drops. As demand outstrips supply, vacancies are at record lows across the globe.
• Record demand stems from a stronger economy and industry-specific factors, such as the rise of e-commerce. Also a factor: Retailers are boosting inventories to make sure consumers get their goods on time.
• Spiking construction costs and land prices produced record high replacement costs. Developers have had to increase rents to bring on much-needed supply.
Global trends and outlook
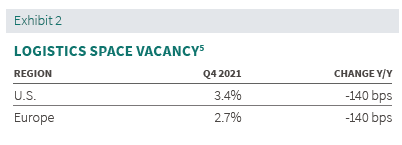
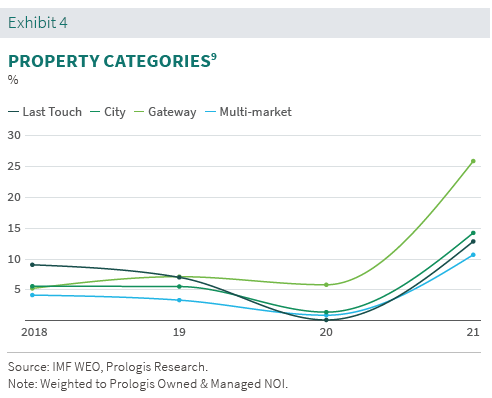
E-commerce fulfi llment and brisk consumer spending are generating record demand. At the same time, harderto-secure materials, labor shortages and land scarcity have slowed the pace of construction completions. As this wave of intense demand bumps up against constrained supply, the amount of vacant logistics space fell to record lows (see Exhibit 2). As a result, most markets are experiencing faster rent growth. Gateway logistics markets recorded the highest rent growth, especially in the U.S. (25.8 percent y/y4 ), where disruptions in the supply chain increased the importance of having control over inventories as soon as possible.
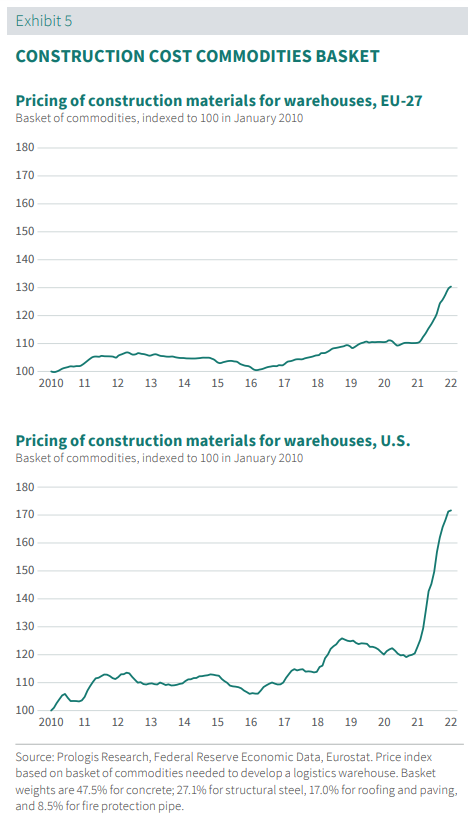
High construction costs have pushed up rents.
A new logistics building is more expensive than ever due to the following:
1. Materials. In 2021, the price of construction materials rose 40 percent in the U.S. and 18 percent in Europe.6
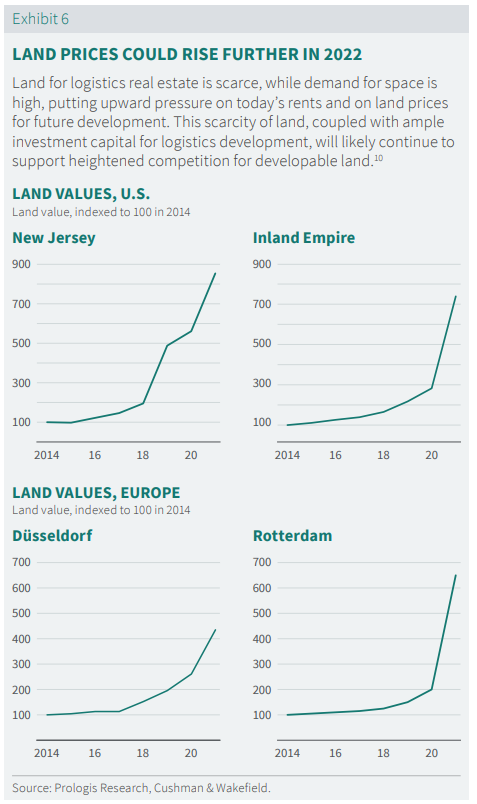
2. Land. Land values rose 50 percent in the U.S./Canada and 40 percent in Europe last year.7 (More detail in Exhibit 6.)
3. Labor. The pandemic exacerbated a shortage of construction workers and added more expense to the bottom line as general contractors increased wages to attract labor.
4. Longer construction timelines. Construction carry costs increased because projects are taking longer to complete. This is partly a function of the size and complexity of today’s logistics buildings, but labor shortages, increased regulatory hurdles and materials delays are also to blame.
5. Building features. Today’s logistics facilities are more sophisticated than ever. Popular requests include renewable energy options, indoor/outdoor amenities, and infrastructure options for automation and other technologies.
Outlook
Global rent growth in 2022 should reach the high singledigits as demand meets or outpaces supply
Pent-up demand—the side effect of robust consumption and the need for supply chains to accommodate higher e-commerce volumes and build resilient inventories—should keep vacancies rates at or near record lows even as deliveries pick up. Inflation could continue to put upward pressure on rents by increasing the cost to build a new facility. Additionally, more customers are willing to pay for the right space, given logistics real estate’s shifting role. Today’s leading online companies spend ~100 bps of revenue on logistics rent vs. 25- 35 bps for traditional supply chains 10 to 20 years ago.8 Taken together, these trends mean customers will face challenging conditions securing space and will need to plan ahead.
Regional Highlights
United States/Canada
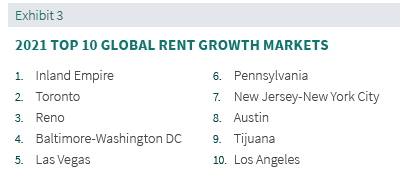
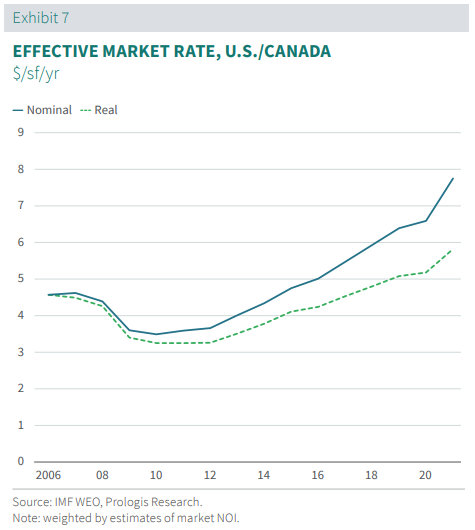
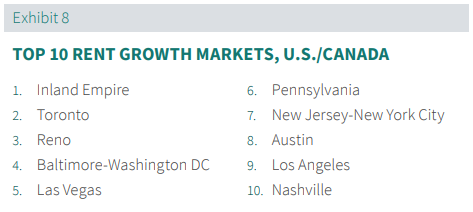
Net effective rents increased by a record 17.6 percent in 2021. Gateway locations recorded the fastest rent growth, led by California’s Inland Empire at 58 percent. Markets near major consumption centers—where units are larger, more available and relatively less expensive—posted some of the fastest growth rates in 2021. We expect that strong demand will buoy rents in these markets, although an influx of new supply in outlying submarkets could slow the pace of growth in 2H 2022 or beyond. Infill logistics space along the coasts recorded moderate growth in 2021 relative to pre-pandemic growth (which led the nation). We expect infill properties to post faster rent growth in 2022 amid dissipating pandemic-related uncertainty (hopefully!). With this would come the need for expanded e-commerce distribution networks.
Europe
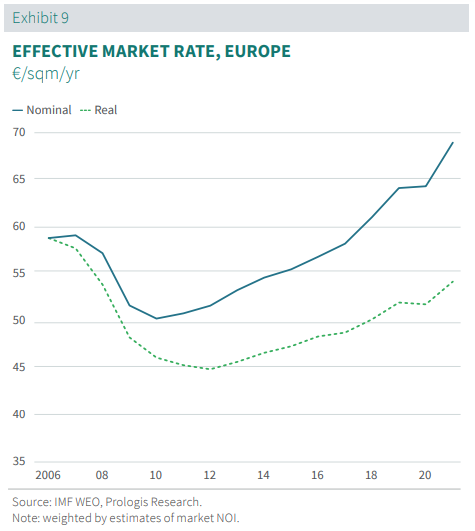
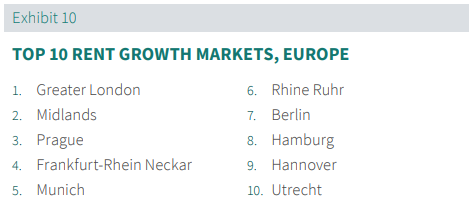
Market rent growth accelerated to a record 7.2 percent in 2021. Despite a broad acceleration of pan-European demand, markets with lower regulatory and geographic barriers to new supply recorded negative rent growth, including Poland, Bratislava and Budapest. Replacement cost growth could shift this dynamic in 2022, as development margins are increasingly under pressure. Markets with the strongest rent growth have very low vacancy and high barriers to new development. UK markets recorded the strongest rent growth in Europe with 13.1 percent. On the continent, rents grew only 4.8 percent in 2021, while replacement costs increased by double-digits. Looking ahead, we expect rent growth to accelerate and narrow this gap.
Asia
China
Rent growth recovered to 2.3 percent in 2021. Around half of the 21 main markets posted rent growth above their long-term average. China’s most affluent consumption centers, namely the Yangtze and Pearl River Delta regions, dominated this list. Here, vacancies remained low due to substantial demand and limited supply. Green shoots appeared in some markets that have struggled with oversupply, including Chengdu, parts of Shenyang, and parts of Nanjing. Rental declines continued in Wuhan, Tianjin and parts of West China.
Japan
Rents grew just under 1 percent in Japan in 2021. Demand kept up with record deliveries of nearly 40 MSF in the two main markets of Tokyo and Osaka. Vacancy rates remained low at 1.5 percent at year-end 2021,11 albeit slightly higher than the prior year. Japan’s low inflationary environment generally keeps the pace of rent growth subdued; however, customers in some infill areas are willing to pay premiums to secure rare, well-located space.
Latin America
Mexico
Net effective rents grew 10.5 percent in the main Mexican markets during 2021, more than recovering the -1.9% drop from 2020. In 2021, e-commerce expansion supported demand in and near large metros while nearshoring activity boosted the border markets. On the supply side, rising replacement costs (up 20-30 percent during 202112) and a lack of viable sites for development drove rent growth as customers competed for few availabilities. We expect rents to continue growing at a robust pace as new supply lags demand in most markets.
Brazil
In Brazil, market rents increased by 11.0 percent in 2021 for the main Southeast markets (Sao Paolo and Rio de Janeiro). E-commerce expansion and flight-to-quality supported demand. Gross absorption reached a record high and supply has not kept pace, slashing vacancies in Sao Paolo. An increased cost of capital could constrain new supply. Combined with expectations for continued strong demand, vacancies could decrease further, driving up real rent growth.
Endnotes
1. Prologis Research tracks rental rates on a net effective basis. Net effective rents are adjusted for free rent. By doing so, we can capture changes in true economic lease terms.
2. The Prologis Rent Index was introduced in 2015 to quantify and analyze rental growth trends across the global logistics real estate sector.
3. Prologis Research. Regional and global rental growth rates are weighted averages of market-level growth rates, using estimates of market revenue as weightings. Market revenue is based on data collected from Prologis Research, CBRE, C&W, JLL, Colliers, CBRE-EA, Gerald Eve, Fraunhofer.
4. These categories are determined at the property level; aggregates are weighted by Prologis portfolio NOI unlike the rest of the document which is weighted against market NOI.
5. U.S. data from CBRE, C&W, JLL, Colliers, CBRE-EA, Prologis Research; Europe data from CBRE, C&W, JLL, Colliers, Fraunhofer, Gerald Eve, Prologis Research.
6. Source: Prologis Research, Federal Reserve Economic Data, Eurostat. Note: Yearover-year as of Dec 2021 in the U.S. and Nov 2021 in Europe. Price index based on basket of commodities needed to develop a logistics warehouse. Basket weights are 47.5% for concrete; 27.1% for structural steel, 17.0% for roofing and paving, and 8.5% for fire protection pipe.
7. Prologis. Note: finished land values, based on Prologis land bank as of (31 Sept 2021) internally valued as of 31 Dec 2021 using development residual models on Q4 2021 market inputs.
8. Prologis Research.
9. These categories are determined at the property level; aggregates are weighted by Prologis portfolio NOI unlike the rest of the document which is weighted against market NOI.
10. Investment Intentions Survey 2022 by INREV and Global Investor Outlook Report 2022 by Colliers.
11. CBRE.
12. Prologis Research.
FORWARD-LOOKING STATEMENTS
This material should not be construed as an offer to sell or the solicitation of an offer to buy any security. We are not soliciting any action based on this material. It is for the general information of customers of Prologis.
This report is based, in part, on public information that we consider reliable, but we do not represent that it is accurate or complete, and it should not be relied on as such. No representation is given with respect to the accuracy or completeness of the information herein. Opinions expressed are our current opinions as of the date appearing on this report only. Prologis disclaims any and all liability relating to this report, including, without limitation, any express or implied representations or warranties for statements or errors contained in, or omissions from, this report.
Any estimates, projections or predictions given in this report are intended to be forward-looking statements. Although we believe that the expectations in such forward-looking statements are reasonable, we can give no assurance that any forward-looking statements will prove to be correct. Such estimates are subject to actual known and unknown risks, uncertainties and other factors that could cause actual results to differ materially from those projected. These forward-looking statements speak only as of the date of this report. We expressly disclaim any obligation or undertaking to update or revise any forward-looking statement contained herein to reflect any change in our expectations or any change in circumstances upon which such statement is based.
No part of this material may be (i) copied, photocopied or duplicated in any form by any means or (ii) redistributed without the prior written consent of Prologis.
ABOUT PROLOGIS RESEARCH
Prologis’ Research department studies fundamental and investment trends and Prologis’ customers’ needs to assist in identifying opportunities and avoiding risk across four continents. The team contributes to investment decisions and long-term strategic initiatives, in addition to publishing white papers and other research reports. Prologis publishes research on the market dynamics impacting Prologis’ customers’ businesses, including global supply chain issues and developments in the logistics and real estate industries. Prologis’ dedicated research team works collaboratively with all company departments to help guide Prologis’ market entry, expansion, acquisition and development strategies.
ABOUT PROLOGIS
Prologis, Inc. is the global leader in logistics real estate with a focus on high-barrier, high-growth markets. As of December 31, 2021, the company owned or had investments in, on a wholly owned basis or through co-investment ventures, properties and development projects expected to total approximately 1.0 billion square feet (93 million square meters) in 19 countries. Prologis leases modern logistics facilities to a diverse base of approximately 5,800 customers principally across two major categories: business-to-business and retail/online fulfillment.
