Throughout 2021, Poland’s rental growth rates and value uplifts remained significantly below those of the rest of Europe, regardless of substantial and robust market activity. Driving disparity is a lack of transparency around true market rents heightened by limited awareness of local investor practices, particularly the use of side letters. Since 2016, Prologis has shared its actual rent level and valuation metrics with the market through its “Rents Uncovered ” series to increase industry-wide understanding. As a responsible developer and leader in logistics real estate, our goal is to create transparency in the market.
We believe that better understanding of actual market rents and full disclosure of leasing terms will bring market growth opportunities to the same performance levels as seen in the rest of Europe. In this edition we dive deeper into the relationship between rents and pricing in Poland.
Market context: Rent growth lags relative to European pricing benchmark
As covered in our latest rent index white paper, net effective rents in Europe grew by 7.2% y/y in 20211, an all-time record. Growth was fueled by low availability, high demand and rising replacement costs. In contrast to other European markets, rent growth in Poland remained negative at -0.5% y/y.1 When analyzing real rent growth (nominal rents minus inflation), the depressed rent trajectory becomes even clearer. Real rents are over 30%2 below 2007-levels and with anticipated high inflation levels this gap is only expected to widen in the near term. Prime net effective market rents average €32 per sqm/year in Poland’s main markets, well below the continental average of €57 per sqm/year.1
While rents and capital values fell significantly short, Poland still saw a record level of activity last year. Investment and net absorption volumes reached the highest levels seen and vacancy declined y/y.3 Notably lower barriers to supply drive this divergence, which is further compounded by a lack of transparency through the widespread use of side letters. Valuation growth over 2021 in Poland was the lowest of all twelve European countries where Prologis owns properties. Capital values are 55% and 40% below neighboring countries Germany and the Czech Republic respectively.4 Despite the lack of rent and capital value growth, the relative pricing benchmark in Poland is at the high end compared with other countries when considering that:
– Cap rates have moved closer to markets where rent growth is already materializing.
Across all European markets cap rates significantly compressed as a result of resilient performance and a favorable rent growth outlook. According to CBRE, the industrial cap rate (prime distribution) for Poland is 4.35% as of December 2021. Cap rates in Italy and the Czech Republic are approximately 40bps lower compared to Poland, which can be considered too narrow a differential given that both markets have seen rent growth of 3.6% and 7.0% in 2021 respectively.1 These markets have higher near future income potential as well, justifying much lower yields. At the other end of the spectrum, Slovakia, another lagging rent growth market, yields are 90bps higher compared to Poland.
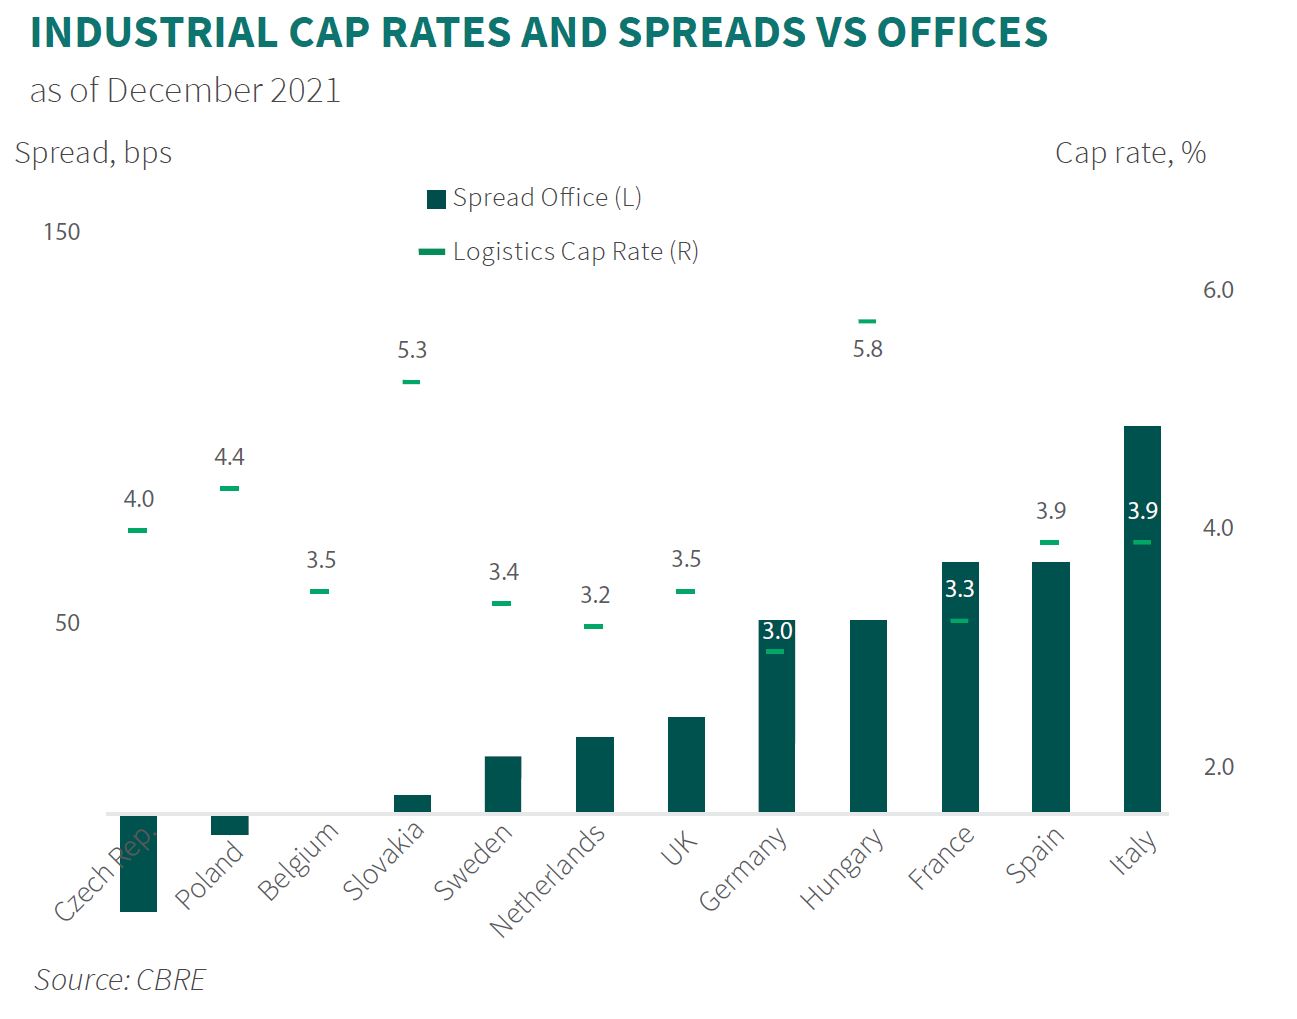
– Industrial, relative to office cap rate spread, lower than the rest of Europe.
Pricing already shifted dramatically since GFC, narrowing the spread of industrial vs. office prime cap rates to over 70bps in the Eurozone today.3 Driven by secular tailwinds and strong (NOI) outlook for our sector, this trend is expected to continue. The potential can already be seen in a mature market like the United States where industrial cap rates are below offices. For Poland, the spread of industrial and office cap rates is already on par.
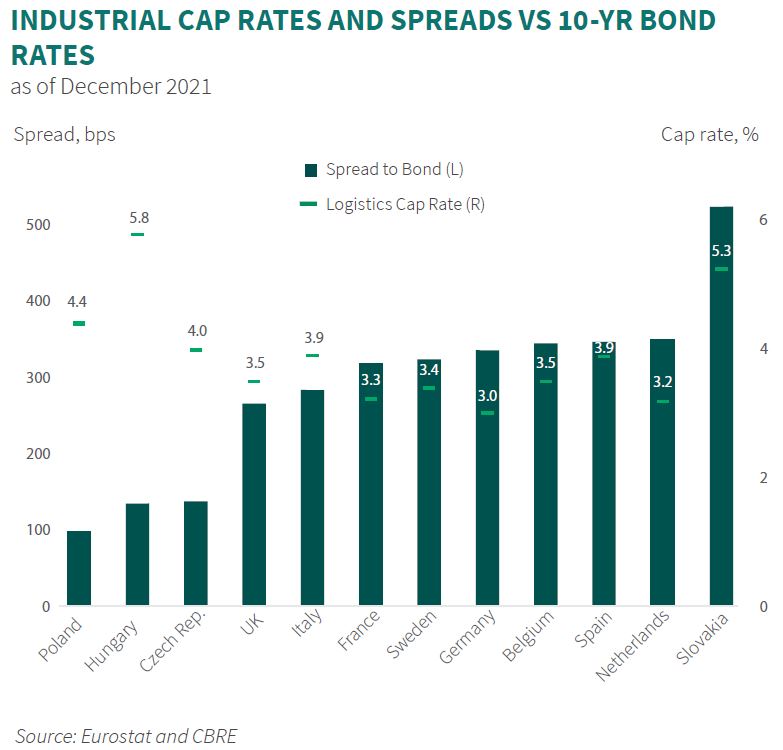
– Poland has lowest spread vs. 10-yr bond rate.
Government bond rates increased sharply in Hungary and Poland towards the end of 2021. The latter having the lowest spread of all markets, considerably lower than established, more defensive and liquid markets like Germany, France and the United Kingdom.
Ahead: More transparency and focus on net effective rental rates should help set realistic expectations
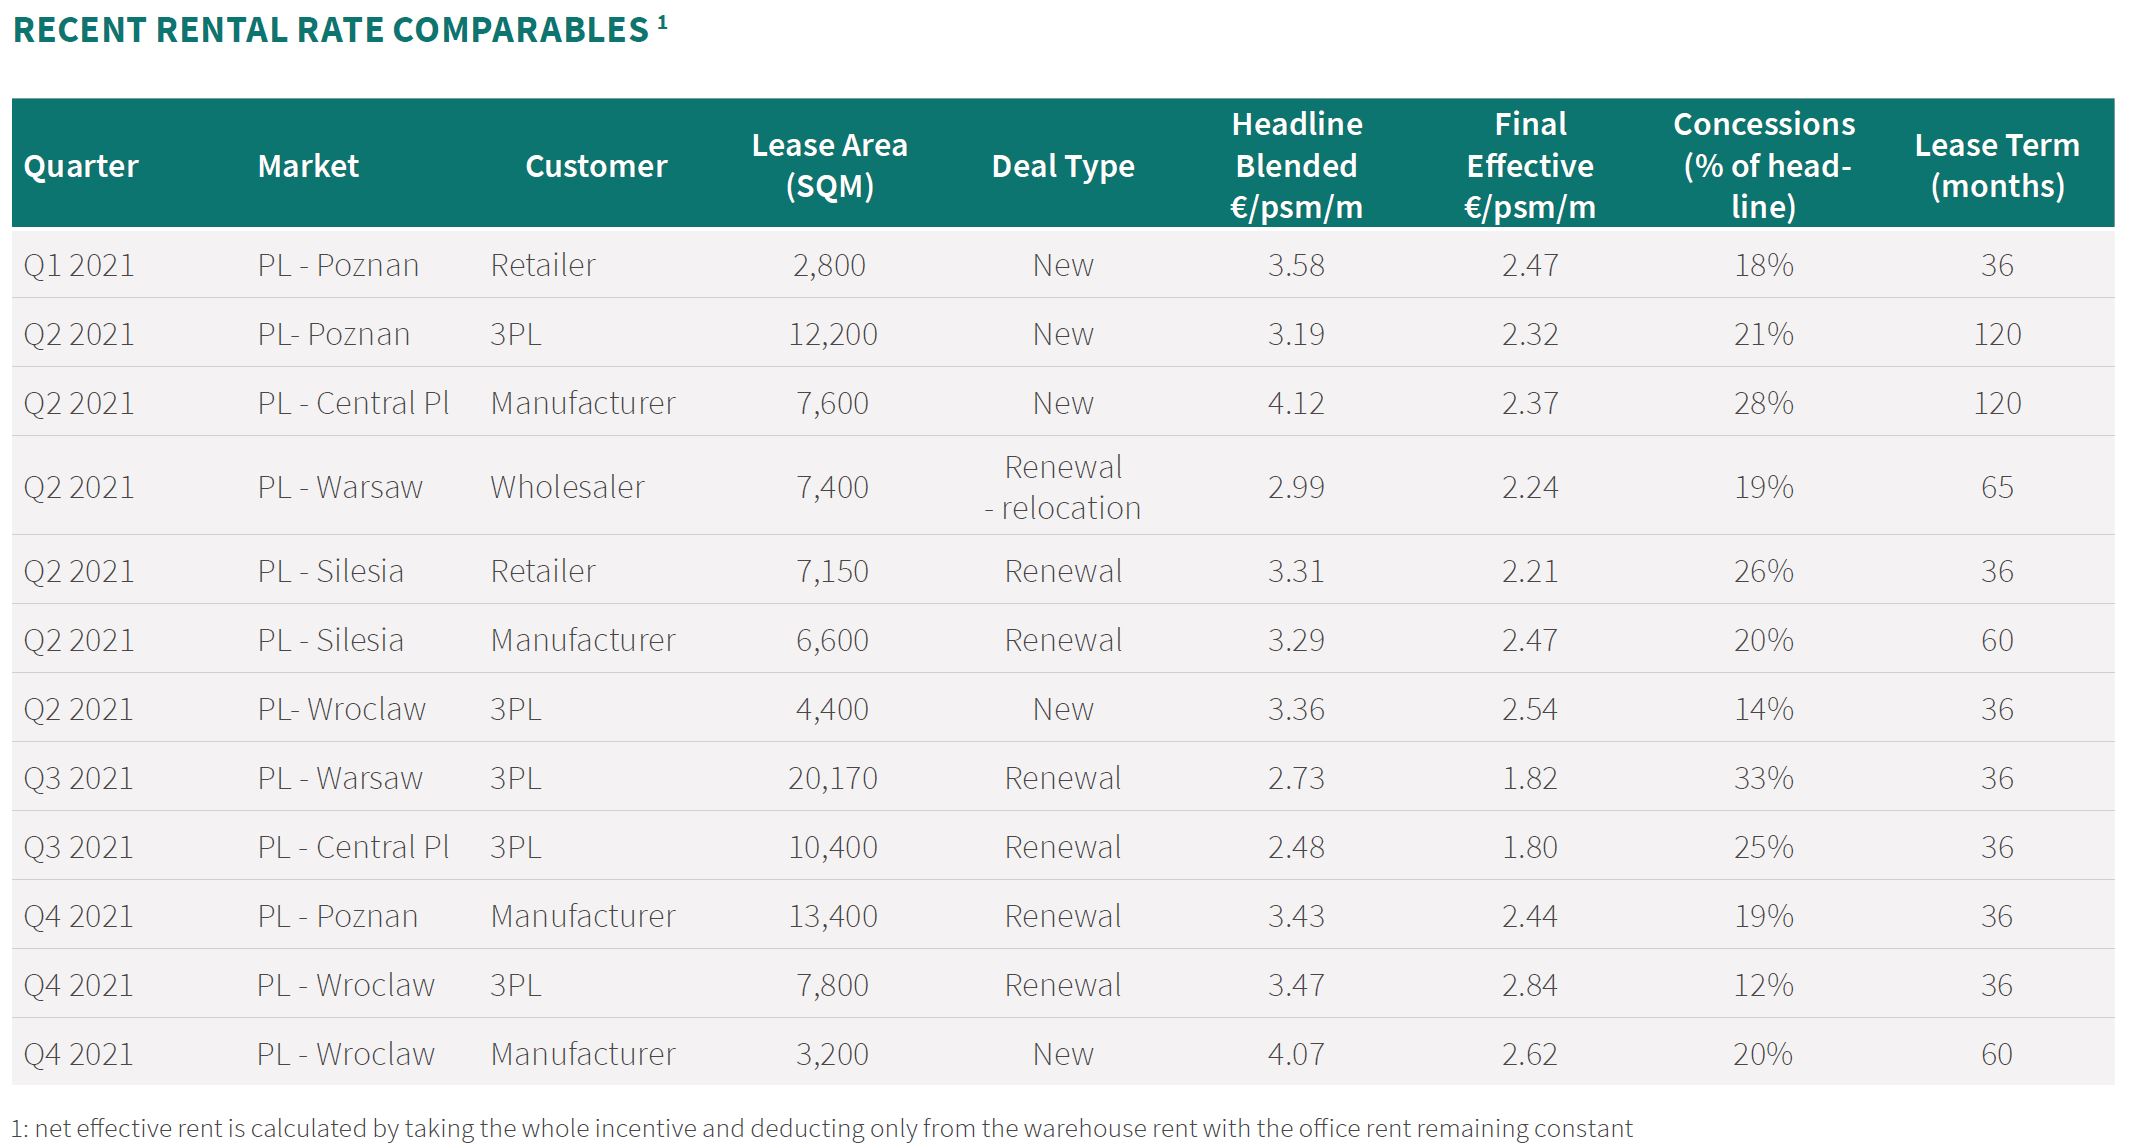
The discount provided in Poland through incentives stands at 25% of headline income, the highest in Europe.4 It is also the only country in Europe where side letters to lease contracts are still widely used. These are additional agreements under which customers receive financial incentives that are not disclosed under the lease agreement. Unsurprisingly, the use of side letters leads to uncertainty. Valuers and investors treat additional incentive agreements as one-offs, which is misleading. The non-transparent structure of concessions is often a surprise when renewal discussions commence. Any financial incentives undisclosed in the lease agreement leads to the risk of artificially inflated nominal rents and project valuations.
The position of valuers also deserves special scrutiny. Valuers are well aware that side letters are commonplace in the market and are potentially opening themselves to reputational and financial risk and claims for negligence if they do not act in good faith and insist on full and complete disclosure of all financial incentives before providing a valuation.
Looking ahead, transparency should improve over time, as Poland adopts global best-practices. Part of this transition will involve the incentives offered in side letters being detailed in the lease agreement so they are no longer confidential and hidden from third parties.
This transition translates into new opportunity once the market behaves in a more economically transparent way. In the meantime, investors and market operators should nonetheless remain conscious of concession circumstances and be aware of true rental rates so as to minimize and isolate these risks.
Lead by example: Bolster understanding of the true value of this promising market by sharing lease transaction and valuations details.
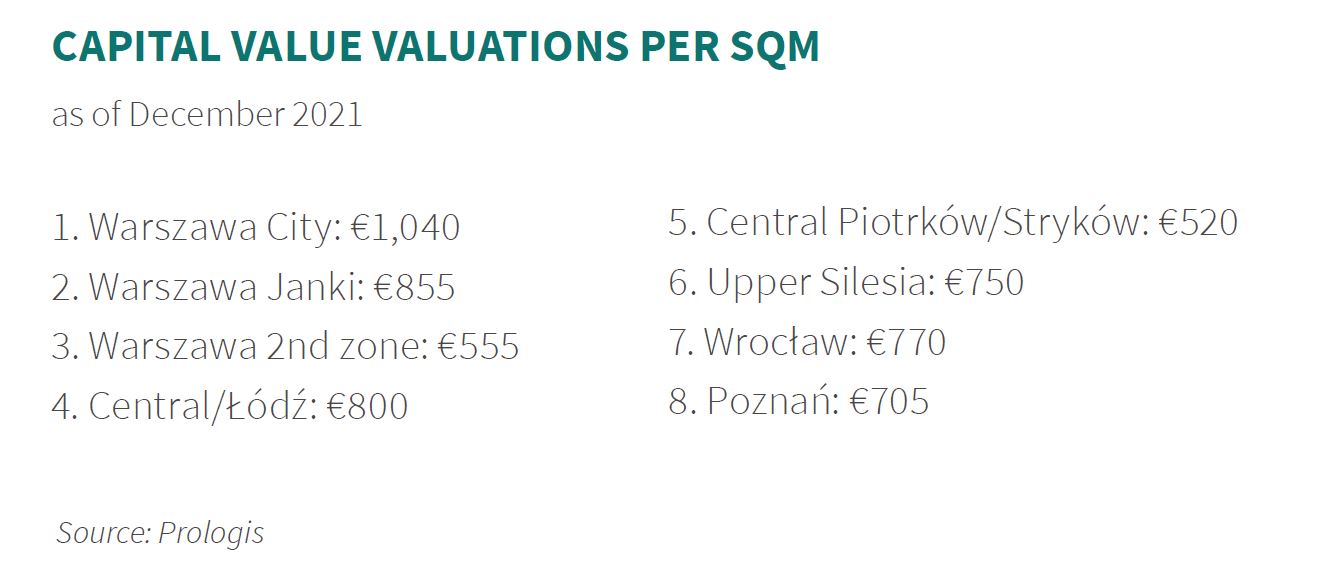
Prologis manages one of the leading logistics real estate portfolios in Poland and the rents we achieve on our properties fully reflect current market conditions. In an effort to improve market efficiency and visibility, disclosed below are the actual rents agreed under typical leases signed in 2021 together with details of our Q4 valuations. Poland has a significant potential to drive investor performance given its strong secular tailwinds. For the Polish logistics real estate market to continue to develop dynamically, business ethics and fair competition standards should uniformly be adopted.
Every market participant has a responsibility to mitigate risk and pay attention to non-transparent contractual practices. By understanding the true value of the Polish market, we are able to make the best investment decisions today and for the future.
Endnotes
1. Source: Prologis Research
2. Source: Eurostat, Prologis Research
3. Source: CBRE
4. Source: Prologis
Forward-Looking Statements
This material should not be construed as an offer to sell or the solicitation of an offer to buy any security. We are not soliciting any action based on this material. It is for the general information of customers of Prologis. This report is based, in part, on public information that we consider reliable, but we do not represent that it is accurate or complete, and it should not be relied on as such. No representation is given with respect to the accuracy or completeness of the information herein. Opinions expressed are our current opinions as of the date appearing on this report only. Prologis disclaims any and all liability relating to this report, including, without limitation, any express or implied representations or warranties for statements or errors contained in, or omissions from, this report. Any estimates, projections or predictions given in this report are intended to be forward-looking statements.
Although we believe that the expectations in such forward-looking statements are reasonable, we can give no assurance that any forward-looking statements will prove to be correct. Such estimates are subject to actual known and unknown risks, uncertainties and other factors that could cause actual results to differ materially from those projected. These forward-looking statements speak only as of the date of this report. We expressly disclaim any obligation or undertaking to update or revise any forwardlooking statement contained herein to reflect any change in our expectations or any change in circumstances upon which such statement is based. No part of this material may be (i) copied, photocopied or duplicated in any form by any means or (ii) redistributed without the prior written consent of Prologis.
Prologis Research
Prologis’ Research department studies fundamental and investment trends and Prologis’ customers’ needs to assist in identifying opportunities and avoiding risk across four continents. The team contributes to investment decisions and long-term strategic initiatives, in addition to publishing white papers and other research reports. Prologis publishes research on the market dynamics impacting Prologis’ customers’ businesses, including global supply chain issues and developments in the logistics and real estate industries. Prologis’ dedicated research team works collaboratively with all company departments to help guide Prologis’ market entry, expansion, acquisition and development strategies.
About Prologis
Prologis, Inc. is the global leader in logistics real estate with a focus on high-barrier, high-growth markets. As of December 31, 2021, the company owned or had investments in, on a wholly owned basis or through co-investment ventures, properties and development projects expected to total approximately 1.0 billion square feet (93 million square meters) in 19 countries. Prologis leases modern logistics facilities to a diverse base of approximately 5,800 customers principally across two major categories: business-to-business and retail/online fulfillment.


