KEY MESSAGES
- Higher inventory-to-sales ratios are key to the future supply chain. Disruptions in the flow of goods will persist beyond the pandemic, driven by structural forces in climate, geopolitics and labor.
- Higher inventories will require 800 million square feet (MSF) of logistics real estate or more to fix the shortage and build in resilience. Logistics real estate leasing is not yet reflecting resilience-driven demand because companies need to first focus on immediate inventory challenges.
- Gateway locations are poised to benefit as the first step on the consumption end of supply chains. Because these locations generally have high barriers to new logistics development, demand is expected to outstrip supply.
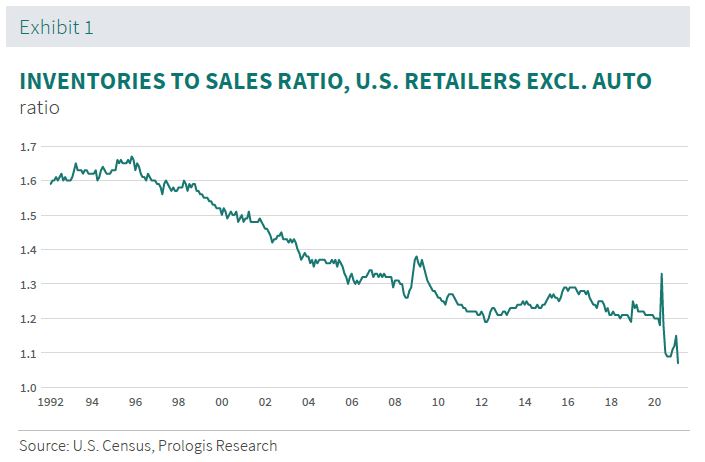
Inventory patterns need to change. Even though the just-in-time model allowed for a structural decline in inventory-to-sales ratios, it also relied on the smooth flow of goods [exhibit1]. The decline steadied in the 2010s as e-commerce grew as a share of the retail business; online channels that offer more product variety by default require more inventory.
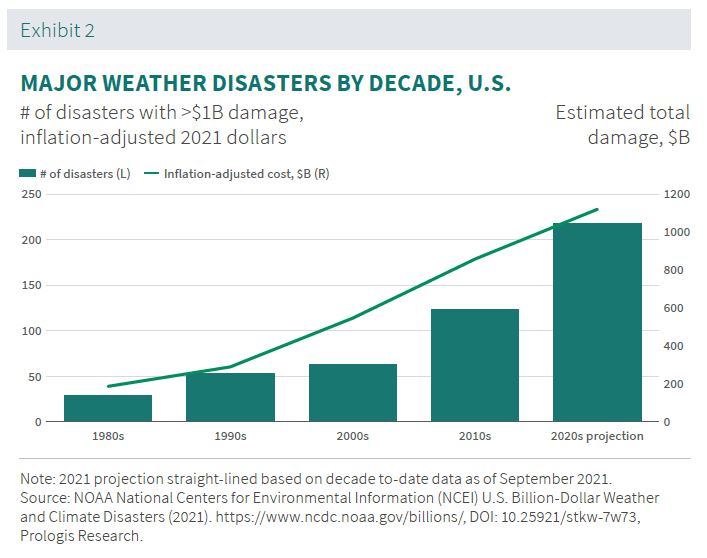
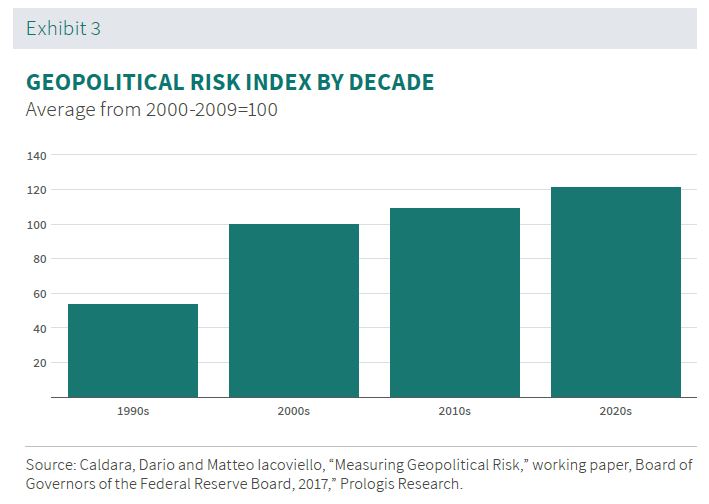
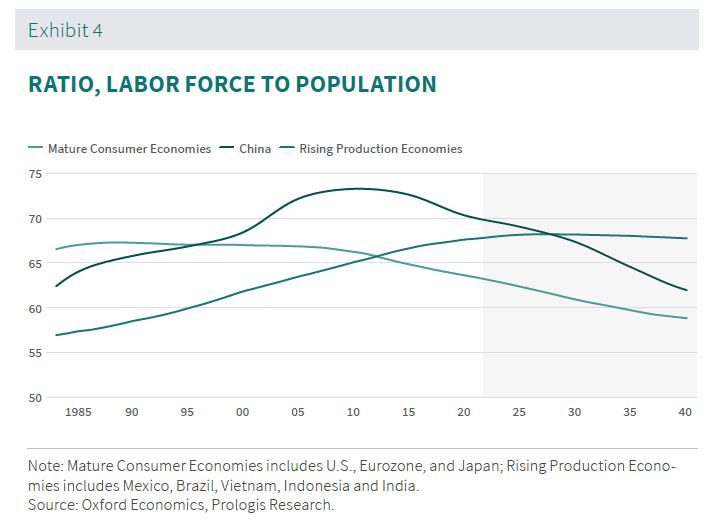
Disruptions are interrupting this flow, as the interconnected structural shifts that drive climate [exhibit 2], geopolitical [exhibit 3] and labor risks [exhibit 4] increase. Today’s disruptions offer a preview: the pandemic; weather (the impact of the deep freeze in Texas on chemical plants, for example); trade (Brexit uncertainties); and labor shortages (drayage constraints and a lack of truck drivers) combined in 2021 to bring widespread shortages, supply chain volatility and higher costs.
Inventory growth will require 800 million square feet (MSF) of logistics real estate or more to fix the shortage and build in resilience.
- Truly resilient inventories could drive the incremental need for 270 to 700 MSF of logistics space in the U.S., based on 5 to 15 percent growth in inventories over the medium term.1 This shift has not even begun to be expressed in logistics leasing because companies are solving for short-term supply chain dislocations.
- The current shortage could require up to 600 MSF of logistics space in the near term, to get back to the average 2010s inventory-to-sales ratio. A big driver is the strength of recent goods sales; retailer inventories would need to increase by 13 percent to accommodate 2021 retail sales levels vs. only 1.5% for 2019 retail sales.2
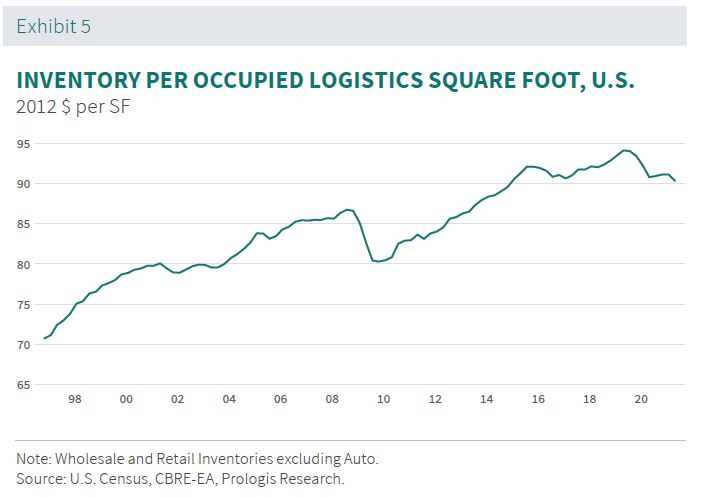
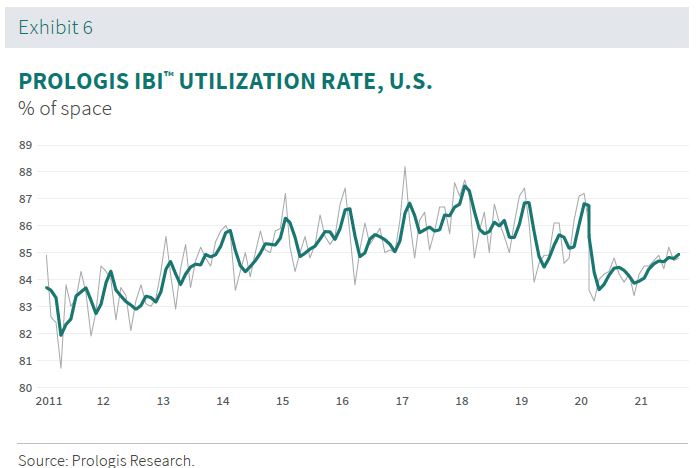
While there is some room in stores and warehouses to accommodate this short-term correction [exhibit 5], the two forces could generate the need for more than 800 MSF of logistics space over the next several years.3 In the top 28 U.S. markets, total vacant and unleased space under construction is less than 600 MSF as of Q3 2021.4
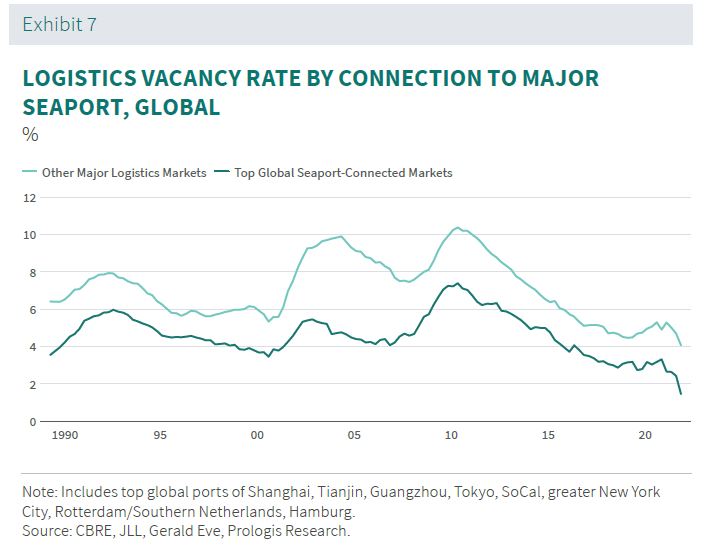
This demand should disproportionately benefit Gateway locations, which offer the greatest optionality for the direction of goods, even as inventories will be spread across a broad range of locations. Locations close to end consumers especially bolster resilience due to immediate distribution potential which could then trigger replenishment from upstream of the supply chain. Secondary or tertiary locations are unlikely to benefit as higher transportation costs outweigh any rent savings. High-and-rising barriers to new logistics development in Gateway locations could push some growth into adjacent markets or increase demand for redevelopment or repositioning options. This scenario is already surfacing as companies aim to get control over inventory quickly: The average vacancy rate in the top global seaport-connected markets is less than 2 percent, about half that of other markets and down from a historical average of 4.7 percent [exhibit 7].5
ENDNOTES
1. Based on coefficients from a 4-factor OLS regression of real retailer inventories excl. auto, real wholesale inventories, real retail sales excl. auto/foods services/gasoline, and e-commerce penetration on U.S. logistics real estate demand growth, spanning from 1996 to 2021. Sources: U.S. Census, CBRE, Colliers, Cushman & Wakefield, JLL, CBRE-EA, Prologis Research.
2. U.S. Census, Prologis Research. Current data for the 12 months from September 2020-August 2021; historical comparison to a CPI-adjusted average for 2019; based on retailer ex. auto inventories and sales.
3. Prologis IBI™ Utilization Rate remained below 85% as of September 2021 vs. all-time high of 87%.
4. Top 28 markets are defined as those where Prologis has a presence. Sources: CBRE, JLL, Colliers, Cushman & Wakefield, CBRE-EA, Prologis Research.
5. CBRE, JLL, Colliers, Cushman & Wakefield, Gerald Eve, CBRE-EA, Prologis Research. Long-term average from 1990-2020
FORWARD-LOOKING STATEMENTS
This material should not be construed as an offer to sell or the solicitation of an offer to buy any security. We are not soliciting any action based on this material. It is for the general information of customers of Prologis.
This report is based, in part, on public information that we consider reliable, but we do not represent that it is accurate or complete, and it should not be relied on as such. No representation is given with respect to the accuracy or completeness of the information herein. Opinions expressed are our current opinions as of the date appearing on this report only. Prologis disclaims any and all liability relating to this report, including, without limitation, any express or implied representations or warranties for statements or errors contained in, or omissions from, this report.
Any estimates, projections or predictions given in this report are intended to be forward-looking statements. Although we believe that the expectations in such forward-looking statements are reasonable, we can give no assurance that any forward-looking statements will prove to be correct. Such estimates are subject to actual known and unknown risks, uncertainties and other factors that could cause actual results to differ materially from those projected. These forward-looking statements speak only as of the date of this report. We expressly disclaim any obligation or undertaking to update or revise any forward-looking statement contained herein to reflect any change in our expectations or any change in circumstances upon which such statement is based.
No part of this material may be (i) copied, photocopied or duplicated in any form by any means or (ii) redistributed without the prior written consent of Prologis.
ABOUT PROLOGIS RESEARCH
Prologis’ Research department studies fundamental and investment trends and Prologis’ customers’ needs to assist in identifying opportunities and avoiding risk across four continents. The team contributes to investment decisions and long-term strategic initiatives, in addition to publishing white papers and other research reports. Prologis publishes research on the market dynamics impacting Prologis’ customers’ businesses, including global supply chain issues and developments in the logistics and real estate industries. Prologis’ dedicated research team works collaboratively with all company departments to help guide Prologis’ market entry, expansion, acquisition and development strategies.
ABOUT PROLOGIS
Prologis, Inc. is the global leader in logistics real estate with a focus on high-barrier, high-growth markets. As of June 30, 2021, the company owned or had investments in, on a wholly owned basis or through co-investment ventures, properties and development projects expected to total approximately 995 million square feet (92 million square meters) in 19 countries.
Prologis leases modern logistics facilities to a diverse base of approximately 5,500 customers principally across two major categories: business-to-business and retail/online fulfillment.
